
|
This function requires that you have to be logged in. If you have an account, login at the upper right then return here. Or, CLICK HERE to begin your membership. Note: We will retain your account so that you may renew at any time, even next season. |
 As the teams travel from one baseball venue to another, the first game of the series will be the highest index. As the two teams play through the series, the index for each team will subside. When the two teams have a similar index, the games will be less affected by air resistance adjustments and therefore tend to be quite competitive. The lowest index for each team in the series will be the last game of that series, with one exception. If a cold weather system or a high pressure system hits during a series, it can change the index for both teams and affect the performance either for better or for worse. Most of the time, the weather forecast is sufficient to anticipate such a change, however periodically a system will catch everyone off guard, including the VMI's for the day.
Keep this in mind:
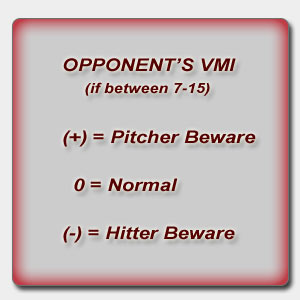
Indices in the PLUS ranges is good - between 7.00 and 15.00 is best, because the most used pitch (the 4-seamer) is lifting and tailing between 1 and 2 inches less than the team is used to seeing; and all the other pitches are moving less, as well.
Index at ZERO is good in that air resistance issues are negated by the players' recent exposure to similar movement. At ZERO, and small plus (+) indices, focus is a much larger issue than is ball movement. These small plus indices indicate the ball is going to move about the same as in several previous games for this team's hitters. This is where focus is more difficult to maintain. Small minuses (-) tend to indicate that with the ball moving slightly more than previous games, the player will be more likely to keep his focus.
Index in the larger MINUS ranges indicates adjustment is more difficult for hitters - between -7.00 and -15.00 is toughest. Pitchers make fewer mistakes when pitching to hitters adjusting from this index range, because all their pitches are more effective. Above minus 15 (-15), pitchers depending on opponents previous days' performance, in lieu of understanding the air, can lead to mistakes, especially on the first game of a new series.
We have added the Year To Date index so that you can keep track of which team has been advantaged more and which has been disadvantaged more over the course of the year. In some cases, the severity of the index indicates that a team has been advantaged by extremely hot weather or an extremely cold period which the other teams may have missed. The result at the end of the year indicates the net amount advantaged (+) or disadvantaged (-) games played. We have moved the decimal two places to the right, so that the comparison will be more meaningful as the season progresses.

© 2020 Air Resistance Technologies, Inc., All Rights Reserved.
BaseballVMI.com, 1326 51st Avenue, Greeley, CO. 80634